

Do Home Prices Fall When Fewer Homes Sell in Santa Clara County?
By April Tavares, Santa Clara County Realtor
20 years of year-over-year MLS comparisons, with a market update through October 2026
When you hear that home sales are down, it’s easy to wonder what that means for your home’s value. Sales volume is a count of how many homes sold. To get a sense of what your own home might sell for, I’d start with what buyers recently paid for similar homes nearby.
I looked at 20 years of Santa Clara County single-family home sales to see how often fewer sales and lower prices went together.
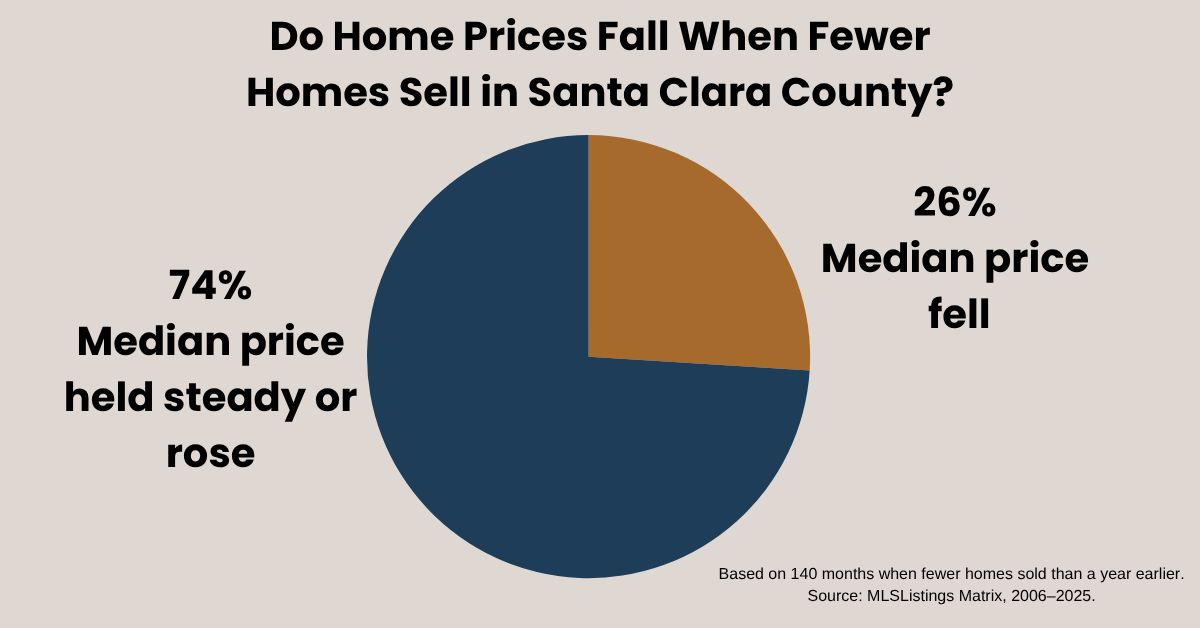
When fewer homes sold than in the same month a year earlier, the median sale price held steady or rose 74% of the time.
What happened to prices when fewer homes sold?
I compared each month from January 2006 through December 2025 with the same month a year earlier. I used the 2005 figures as the starting point, so the table covers 240 monthly comparisons.
| Number of homes sold | Median price rose or held steady | Median price fell | ||||||||||
|---|---|---|---|---|---|---|---|---|---|---|---|---|
| Fewer homes sold | 104 of 140 months (74%) | 36 of 140 months (26%) | ||||||||||
| Sales held steady or rose | 76 of 100 months (76%) | 24 of 100 months (24%) |
Leaving out 2008 and 2009, the median sale price still held steady or rose in 103 of the 134 months when fewer homes sold than a year earlier, or 77% of the time.
Even when at least 10% fewer homes sold, the median price held steady or rose in 59 of 81 months, or 73%. In every month of 2006, fewer homes sold than in the same month of 2005, and the median price was higher each time. October 2026 gave us a more recent example. 11.6% fewer homes sold than the previous October, and the median sale price rose 5.2% to $2.01 million. Santa Clara County Association of Realtors, October 2026
The median is the middle price when you line up the homes that sold from cheapest to most expensive. If more smaller homes sell one month, the middle price can come down even if a home like yours would sell for about the same amount.
Santa Clara County during the 2008–2009 downturn
In 2008, Santa Clara County reported about 6,200 foreclosures, the equivalent of roughly 1% of all housing units in the county. That total includes rentals. The effect could be bigger in neighborhoods where several foreclosed homes came up for sale at once. In the 20 years I reviewed, every month when the median sale price fell 20% or more from a year earlier was part of the 2008–2009 downturn. Santa Clara County Assessor · Historical housing counts · Federal Reserve foreclosure research
Across both rows of the table, 20 of the 60 months (33%) when the median sale price was lower than a year earlier occurred in 2008 or 2009. Looking only at months when fewer homes sold and the median price fell, 5 of 36 (14%) occurred in those two years. All five were between February and June 2008.
For a comparison with today, look at notices of default, an early step in foreclosure. Santa Clara County recorded 11,740 in 2008, compared with 583 in the 12 months through October 2026. Historical DataQuick counts · Recent recorded notices
What I look at when sales slow
I look at whether owners are under pressure to sell. Can people keep making their payments? If they do need to sell, do they have enough equity to pay off their loans? Here’s what I see locally.
- Jobs. Santa Clara County’s unemployment rate was 4.2% in September 2026, compared with 11.5% in September 2009. That’s a big difference when you’re looking at how many households may struggle to keep up with their payments. U.S. Bureau of Labor Statistics unemployment data via FRED
- Home equity. In the second quarter of 2026, about 6 in 10 mortgaged homes in the San Jose metro had at least half their estimated value in equity, according to ATTOM. In other words, the loans on those homes added up to half the home’s value or less. That gives many owners a cushion if they need to sell when prices are lower. ATTOM’s home equity report
- How buyers qualify for a loan. Federal rules put in place after the housing crisis generally require lenders to check that borrowers can afford to repay their mortgage. For most home loans, lenders verify the income or assets they rely on and consider the borrower’s other debts. If a loan starts with a low introductory rate that later goes up, qualification generally has to account for the higher payment. Consumer Financial Protection Bureau’s ability-to-repay rule
Put those facts alongside the much lower number of default notices, and I see less pressure on homeowners to sell than there was during the last housing crisis. That’s why I’d pay closer attention to rising job losses or mortgage defaults than to a headline about fewer homes selling.
If you’re wondering whether to wait
If you’re buying, start with a monthly payment you’re comfortable with. Then look at what similar homes have sold for and how long the ones you like have been sitting. A home that’s been on the market for several weeks may give you room to ask for better terms, even if the countywide median is up.
If you’re selling, start with the homes a buyer would tour on the same weekend as yours. We can look at how your home compares, what similar homes actually sold for, and what you’d keep after selling costs. Then you can decide whether making a move now works for you.
What prices do next is uncertain. Looking at what’s happened here before helps us weigh the risks of moving now or waiting and leave ourselves some breathing room if the market shifts.
If you’ve been waiting because the headlines have made the market feel uncertain, we can start by looking at your neighborhood, your price range, and your timing. Sometimes those numbers give you a good reason to wait. Sometimes they give you a good reason to take a closer look.
About the numbers. I used MLSListings Matrix records for Santa Clara County single-family homes from January 2005 through December 2025. The first 12 months provide the baseline for 240 year-over-year comparisons from 2006 through 2025. The table compares the change in the number of homes sold with the change in median price in the same month. Prices can also respond later. Among the 78 months when sales fell by at least 10% and a full year of follow-up was available, 37 had at least one of the following 12 months with a year-over-year median price decline of at least 10%. Those follow-up periods overlap, so one downturn can count more than once. The October 2026 figures come from a separate local report. Historical and recent default counts come from different providers and measure the same type of filing.
Categories
- All Blogs (45)
- Client Stories (1)
- Coming Soon (1)
- Community Happenings (3)
- First Time Home Buyers (6)
- For Sale (8)
- Home Buying (5)
- Home Buying Tips (9)
- Home Decor (1)
- Home Seller Resources (7)
- Home Selling Tips (9)
- Homeownership Tips (5)
- Life Happens, Homes Change (14)
- Life in Silicon Valley (5)
- Local News & Updates (3)
- Market Insights (2)
- Relocation (2)
- San Jose Real Estate Market Insights (2)
- Santa Clara County (4)
- Santa Clara County Market Stats (7)
- Saratoga Real Estate (1)
- Seller Guidance (3)
- Silicon Valley Housing Trends (3)
- Silicon Valley Real Estate (7)
Recent Posts







GET MORE INFORMATION
